PMT Voltage Optimization
Typical flow cytometer instruments use photomultiplier tubes (PMTs) to detect fluorescence in the samples. The initial signal (light hitting the detector) is amplified within the PMT to improve the sensitivity and resolution of the measurements. The final signal intensity shown in your data plots therefore depends not only on the actual staining (expression level of the marker of interest) but also on the degree of the signal amplification. The signal amplification is controlled by PMT voltage and in most instruments this is a user adjustable setting that should be optimized separately for each fluorophore (detector) in your assay (it might be compared to e.g. exposure time in light microscopy).
- Too low PMT voltage → Dim signals have high data spread and are not well-resolved from background
- Too high PMT voltage → Bright signals fall out of linear range of detection
- Optimal PMT voltage → Separation between negatives and positives is maximized and experimental samples remain in the linear range
In simple assays PMT voltages can be adjusted by simple visual check of adequate separation between negative and positive populations while making sure that the signals remain in the linear range. In more complex cases it is advantageous to actually optimize the voltages to maximize the assay performance. This is best done by running stained biological sample (or bright fluorescent multicolor beads) at increasing voltage intervals for each detector and calculating the separation index (see Ab titration for the mathematical formula) between negatives and positives at each setting; this is commonly called voltage walk or voltration (Fig. 1.).
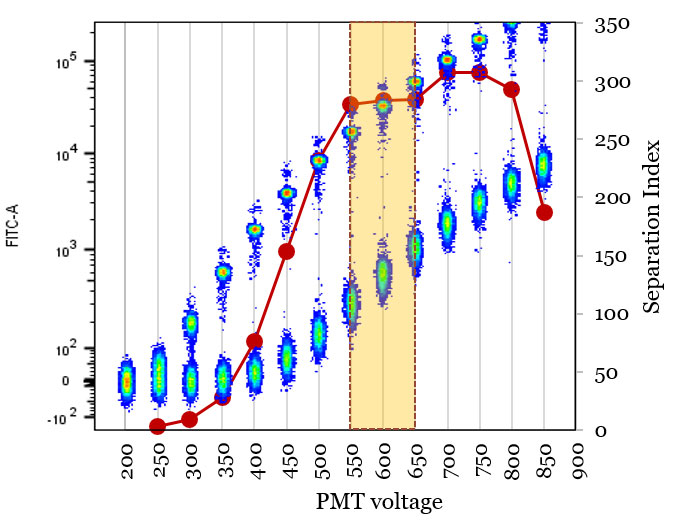
Fig. 1. A voltration experiment using a mixture of negative and FITC-labeled beads to optimize PMT voltage. Optimal voltage range (yellow highlight) gives maximal separation between the populations while retaining all the signals in linear detection range.
Additional Information:
- Maecker and Trotter (2006) Flow cytometry controls, instrument setup, and the determination of positivity. Cytometry A. 69A:1037-1042, doi: 10.1002/cyto.a.20333 (external link)
- Voltage optimization article at BiteSizeBio (external link)