Analysis for Common Cellular Targets
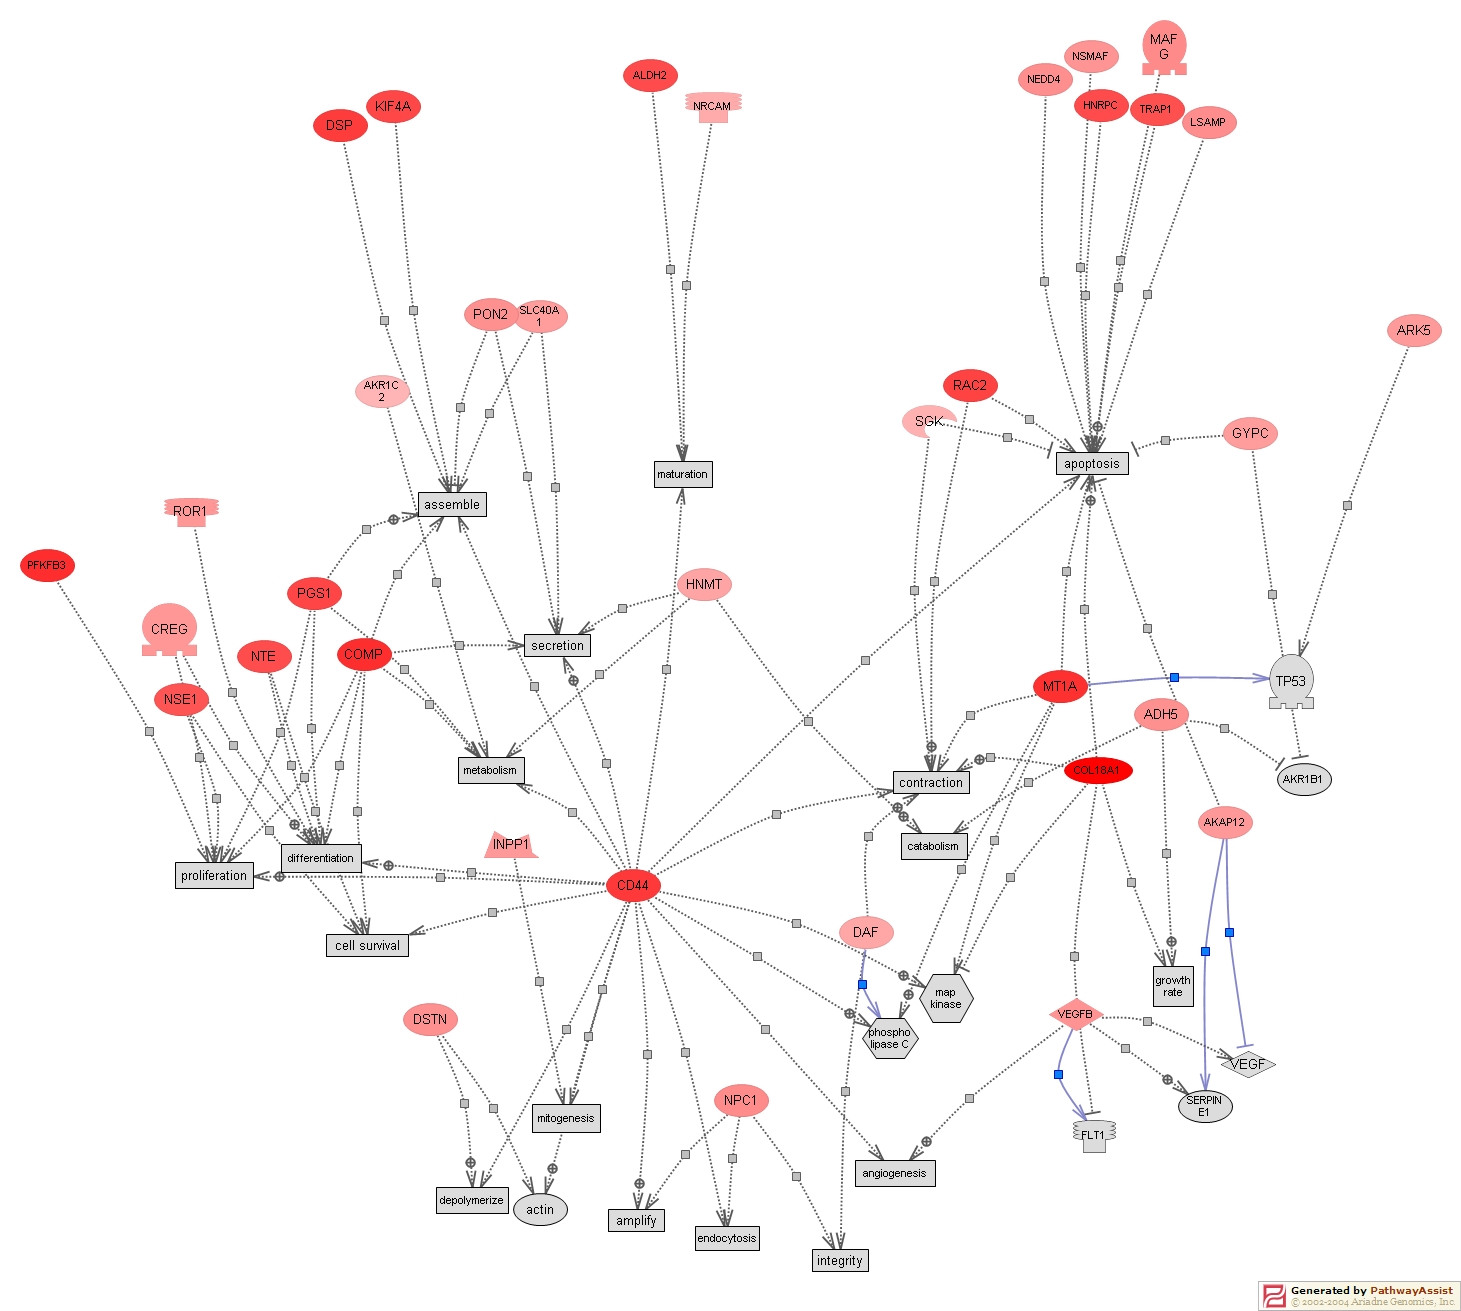
FIGURE 3A. Analysis for common cellular targets. First 71 genes differentially expressed during class comparisons was used in this analysis (nominal p=0.006). Pathway Assist (Ariadne Genomics, Rockville, MD) a software tool for biological pathway analysis was used. It relies on ResNet, a database specifically targeted at the extracting data from the language of scientific abstracts from PubMed in order to identify relationships among genes, visualize pathways, gene regulation networks and protein interactions. This analysis used ResNet 3.0 (Medline August, 24,2004). To simplify the network, genes that could not be linked together were removed. Genes that are increased in SSc fibroblasts are colored red, and genes that are decreased colored pink. Cellular processes that inserted by Pathway Assist to link the genetic networks are colored gray. The boxes on the arrows are hyperlinks indicating relationships of the genes and targets.