Cluster Analysis
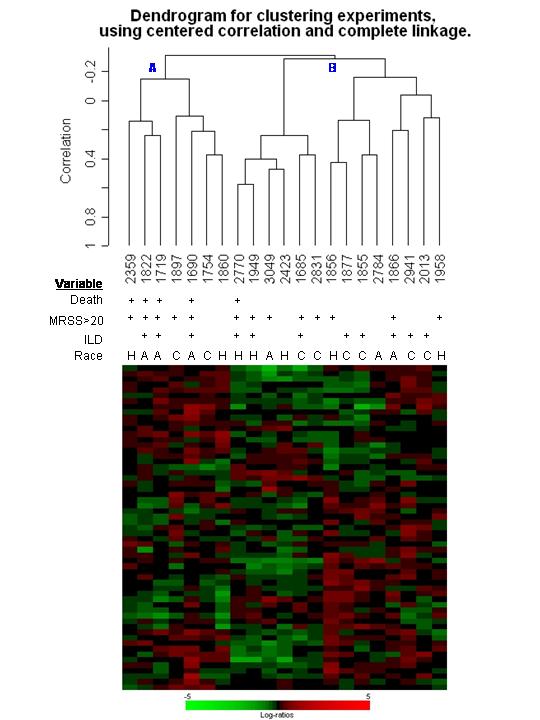
Figure 2. Fibroblasts explanted from patients clinically classified as diffuse systemic sclerosis show molecular heterogeneity. The genes here were selected based on differential expression between SSc and normal fibroblasts (p=0.043 level, see manuscript). The resulting in 832 genes were used for cluster analysis of SSc fibroblast RNA samples. The figure illustrates the relative expression of these genes. Two major subgroups of SSc patients were observed, one with 7 (group A) and the other with 14 patients (group B). It is interesting to note that in group A, 4 of 7 (57%) patients are died within 3 years of follow-up, compared to 1 of 14 (7%) in group B (Fishers exact p=0.025). Patients in group A also tend to have higher median MRSS than patients in group B (MRSS 36.5 vs 22.5), but the difference was not statistically significant. In group A, 3 of 7 had interstitial lung disease compared to 8 of 14 (42% vs 57%) in group B. Genes comprising the clusters are listed in the accompanying TABLE.