Cluster Figure
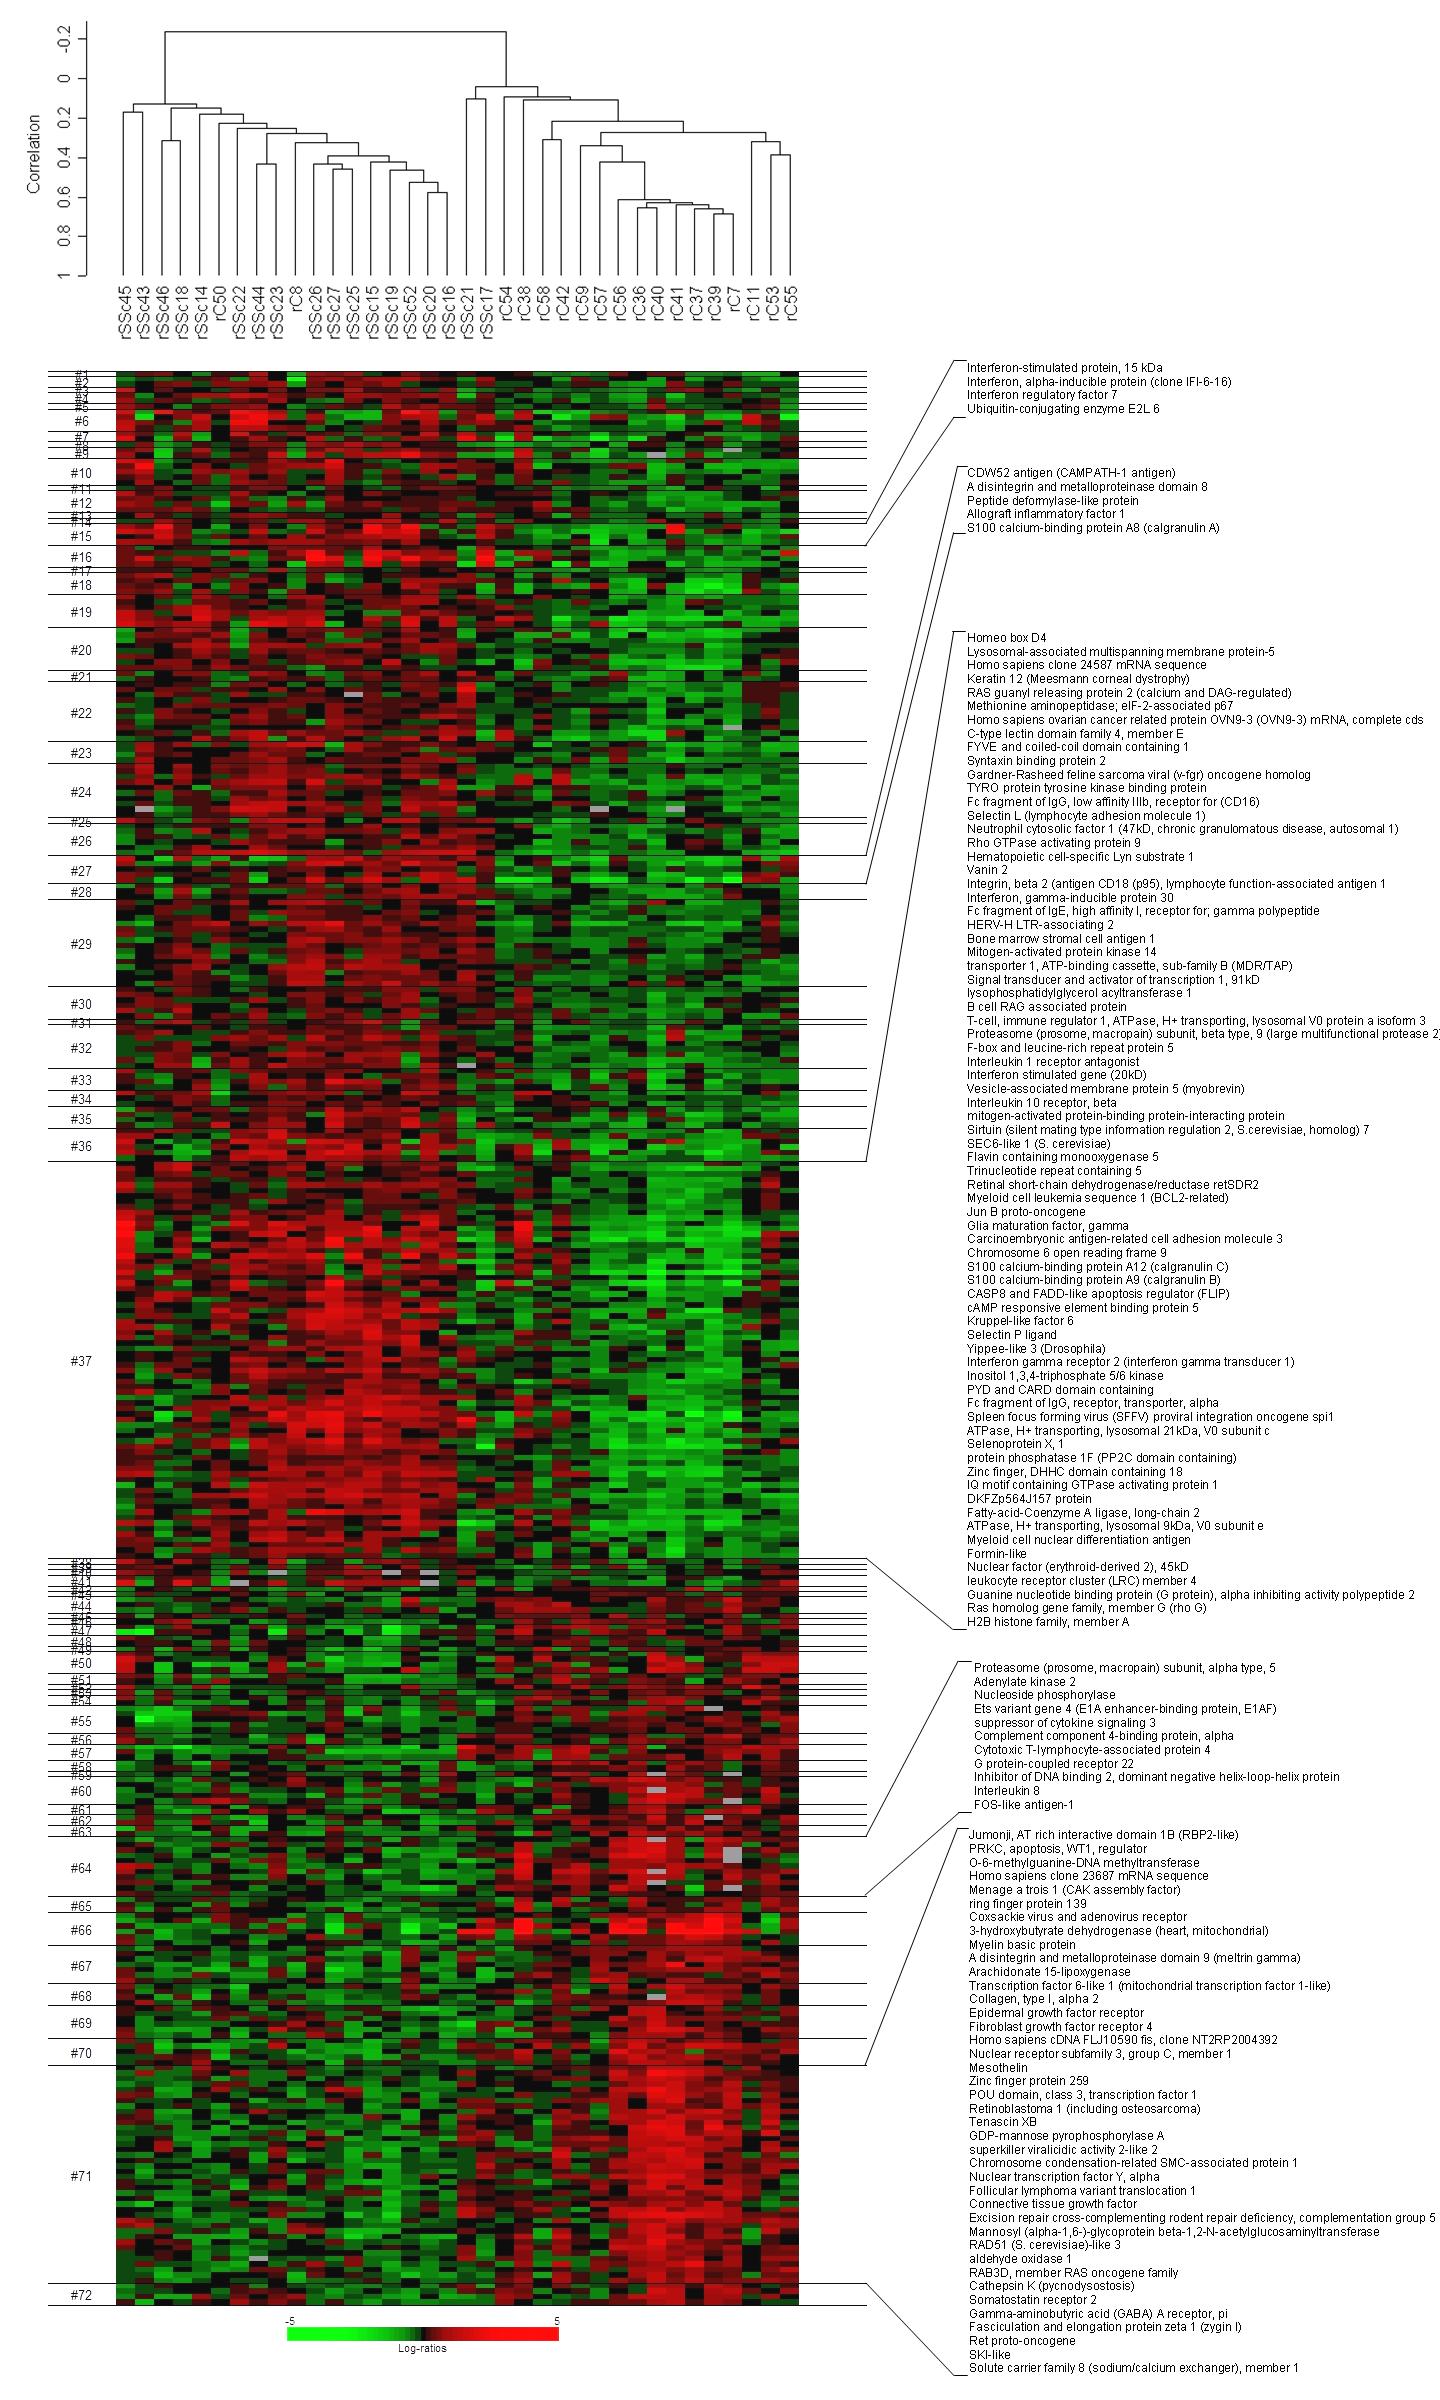
Figure 1. Hierarchical clustering of PBC (genes and samples)
The genes panel used here were the 382 genes differentially expressed at a conditional false discovery rate of ≤ 0.10 (p<0.006). Centered correlation metric and average linkage clustering was used. The genes comprising several clusters of interest (#15, #27, #37, #64 and #71) are shown to the right of the heatmap. rSSc – scleroderma PBCs; rC – matched control PBCs