Hodgkin-Huxley
This subdirectory contains simulations that illustrate how SNNAP can be used to simulation Hodgkin-Huxley-type models of neurons.
Biophysics 01
This file contains a brief description of the SNNAP simulations contained in Biophysics_01.zip. Also included is a brief PowerPoint presentation (biophysics.ppt) that contains some figures keyed to the simulations.
These simulations were developed as a “lab exercise” for a graduate level class that focuses on the biophysical properties of neurons. The first set of simulations were developed to reproduce some of the experiments of Hodgkin, Huxley and Katz. These simulations include:
- Lab_01_Squid
- AccommodationAnode_BreakRefractorySpike
Voltage_Clamp
- AccommodationAnode_BreakRefractorySpike
- Lab_02_I_A
- Delay
- Frequency
- Lab_03_I_Kca
accommodation
Lab 01 Squid
These simulations are based on the Hodgkin-Huxley model (PPT Figs. 1-3) of the squid giant axon. The parameters have been adjusted to reflect modern conventions (e.g., inward currents are downward deflections in the voltage-clamp records and voltages refer to absolute membrane potential and not relative voltage-clamp potentials). In addition, the model was scaled from 1 cm2 to 0.001 cm2, which makes the parameters and simulations more compatible with the units used in SNNAP. All simulations are for a model at 6.3 degrees C and for a single patch of membrane (i.e., Equ. 26 of Hodgkin and Huxley 1952d). (Examples of propagating action potentials will be forthcoming.)
Accommodation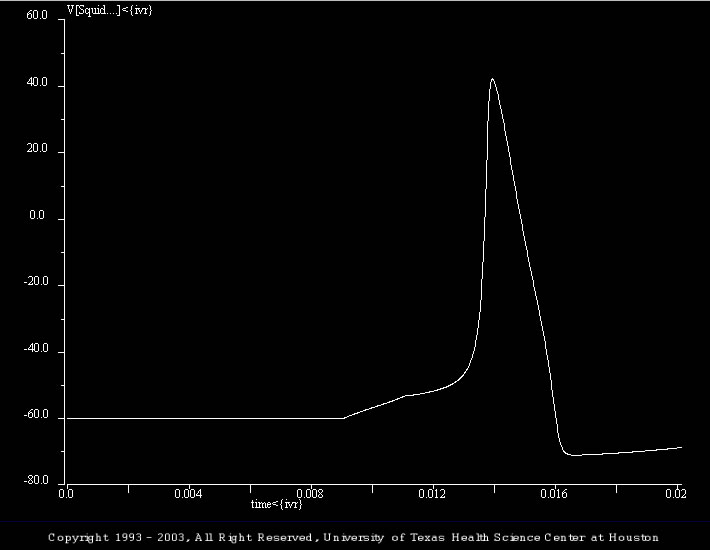
There are three simulations in this set. They illustrate an interesting dynamical property of the model. Specifically, that when dealing with active membrane (as opposed to passive membrane), one cannot simply think of depolarizations as being excitatory.
The initial simulation (Accom_01.smu) illustrates a control action potential, which was elicited by a brief (2 ms) depolarizing current pulse (4 nA). The batch file (i.e., trt_Accom_01.bch) systematically steps through a series of progressively larger depolarizing currents (i.e., 2, 3, 4, 5, and 6 nA).
Anode Break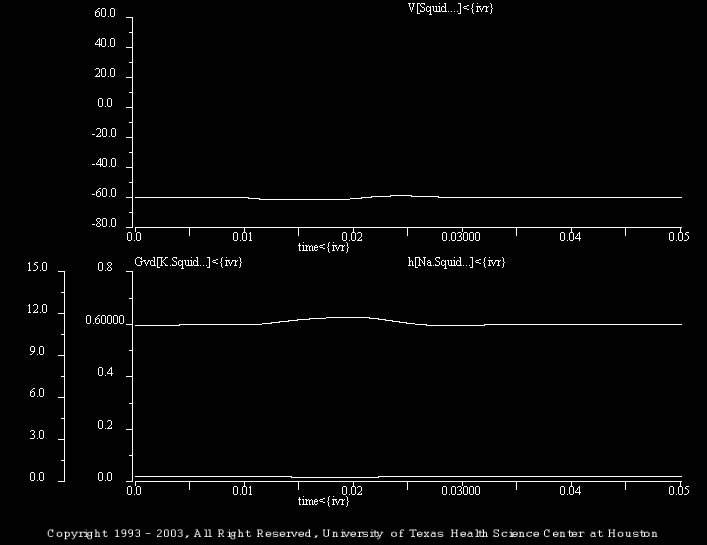
There are two simulations in this set. They illustrate an interesting dynamical property of the model. Specifically, that when dealing with active membrane (as opposed to passive membrane), one cannot simply think of hyperpolarizations as being inhibitor.
This simulation (Anode_02.smu) illustrates the response to a brief (10 ms) hyperpolarizing current pulse (-1 nA) and illustrate the potassium conductance (i.e., “Gvd[K.Squid…]<{ivr}”) and the sodium conductance inactivation gating variable (i.e., “h[Na.Squid…]<{ivr}”).
The batch file (i.e., trt_Anode_02.bch) illustrates the responses to –2.5 and –3 nA pulses and the underlying changes in potassium conductance and sodium inactivation.
Refractory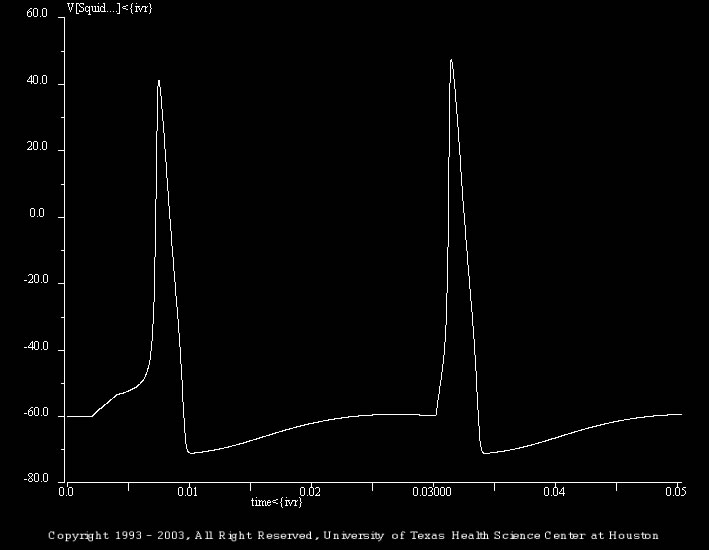
There are three simulations in this set. They illustrate the relative and absolute refractory periods, which follow an action potential.
The shown simulation (Refrac_02.smu) illustrates the absolute refractory period. The initial simulation illustrates the response of the model to two depolarizing current pulses that are separated by 28 ms. The first stimulus is 2 ms and 3.9 nA. The second stimulus is 2 ms and 28 nA. Note the large increase in the magnitude of the second stimulus.
The batch file (i.e., trt_Refrac_02.bch) progressively shifts the time of occurrence for the second stimulus. The second pulse follows the first by 10, 12, 16, and 18 ms.
Spike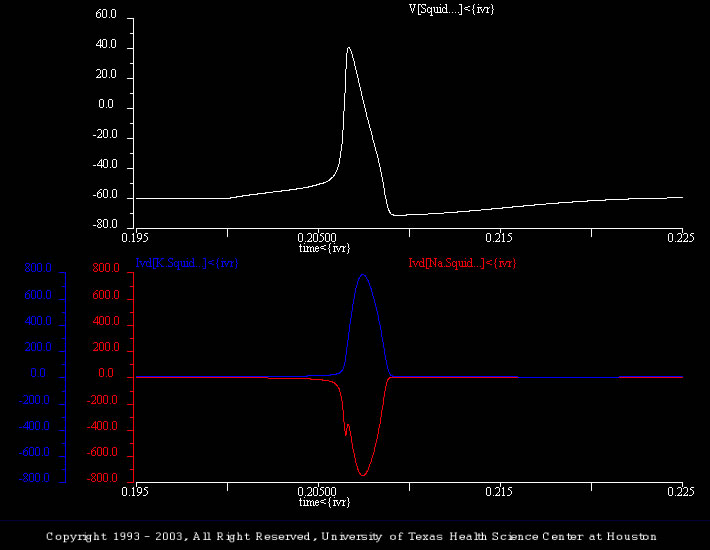
There are six simulations in this set. They illustrate the action potential, the underlying conductances and currents and several dynamic properties of the model (i.e., Accommodation, Anode Break Excitation and the Absolute / Relative Refractory Periods).
The simulation shown (Spike_05.smu) illustrates a control action potential and plots the underlying changes in the sodium and potassium currents.
Students should note the different time courses of the two currents (e.g., the “delay” in the potassium current) and compare how the currents and conductances (see previous simulation) are different / similar (e.g., the sodium conductance rises monotonically, whereas the sodium current does not).
Voltage Clamp
There are two simulations in this set. These simulations illustrate the voltage-clamp response of the Hodgkin-Huxley model.
The simulation shown here (V_C_Ina_Ik.smu) simulates a voltage-clamp experiment (Vh=-60 mV and Vc=-10 mV; duration is 10 ms) and display the membrane voltage, total membrane current, the isolated Na current and the isolated K current.
Students should note the different time courses of the Na and K currents (e.g., Ina inactivates, whereas Ik does not). In addition, the students should systematically alter magnitude of the voltage-clamp step (i.e., the “magnitude” parameter in the file V_C_Ina_Ik.trt) and plot the magnitude of Ina and Ik. (PPT Figs. 4, 5, 11-18).
Lab 02 I A
These simulations are loosely based on the studies of Byrne (1980a, b) and illustrate the role(s) of the transient potassium current (i.e., A current). The simulations utilize a “generic” neuron, which is similar to the Hodgkin-Huxley model but does not use rate constants. Thus, it is easier for users to change the properties of the model in an intuitive manner.
Delay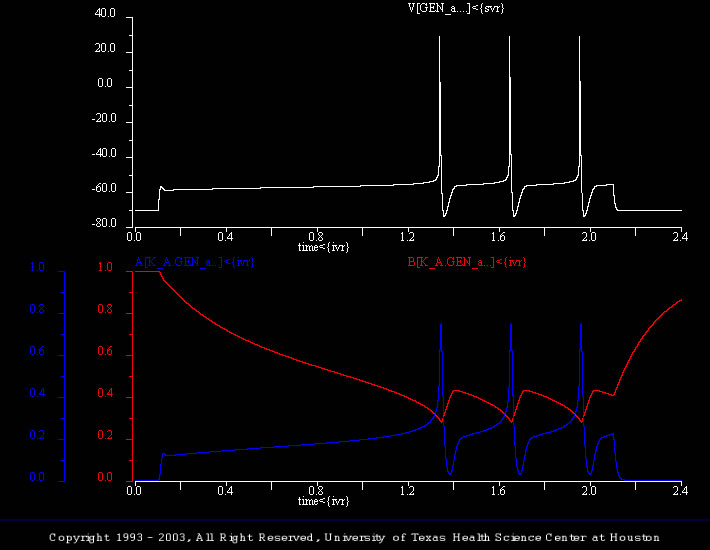
There are five simulations in this set. They illustrate the current- and voltage-clamp responses of the generic cell with and without the A current.
This simulation (generic_cell_04.smu) utilizes the extended model and illustrates the response of the model to a supra threshold stimuli. In addition to the membrane voltage, the activation and inactivation of the transient potassium current are plotted (i.e., “A[K_A.GEN_a…]<{ivr}” and “B[K_A.GEN_a…]<{ivr}”, respectively).
Frequency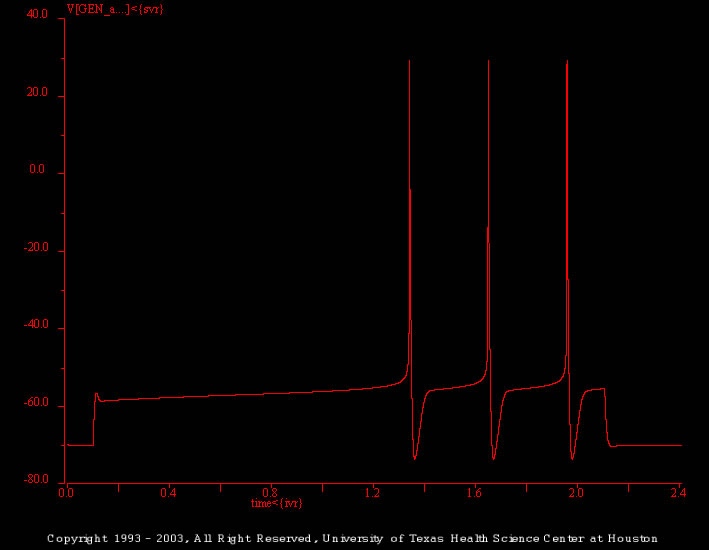
There are two simulations in this set. These should be used by the students to “explore the parameter space” of the extended model and to investigate how the features of the A current effect firing in the model.
This simulation (generic_cell_02.smu) illustrates the response of the extended model to a supra threshold stimulus (2 s, 2.3 nA). As before, the model begins to fire after an initial delay.
Lab 03 I Kca
These simulations utilize the “generic_cell” model and illustrate the role(s) of the calcium-activated potassium current (i.e., I_Kca) in neuronal properties. To simulate a I_Kca, the generic_cell model was extended to include an intracellular pool of ions, which in turn positively regulate an outward current. (Note, for the purposes of simplicity, an explicit calcium was not added to the generic_cell model. Rather the inward current, i.e., I_Na, was assumed to have a calcium component.)
Accommodation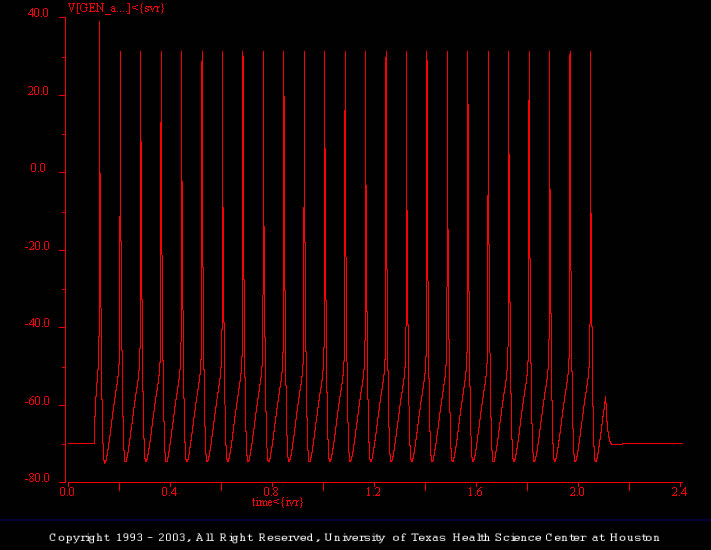
This simulation illustrates the response of the generic_cell model to a prolonged (2 s) depolarizing current pulse (2.3 nA). As illustrated previously, the generic_cell fires continuously throughout the supra threshold stimulus.
Generic Cell
The goal of the present simulation (generic_cell.smu) is produce a simple model of a spiking neuron.
This subdirectory contains the files used to generate a robust, simple HH-type spiking cell. This model was used in many of the examples included with SNNAP. The model is not based on any given experimental data. Rather the model was intended to be a ‘generic’ neuron that can be easily adapted to any number of uses.
The results of the generic_cell.smu are illustrated in genericCell.gif. A number of additional simulations are include. These illustrate other features of the generic model, such as its excitability, spike waveform and membrane properties. In addition, a number of batch files (i.e., *.bch) are include. These the response of the generic model over a range of conditions.
MCM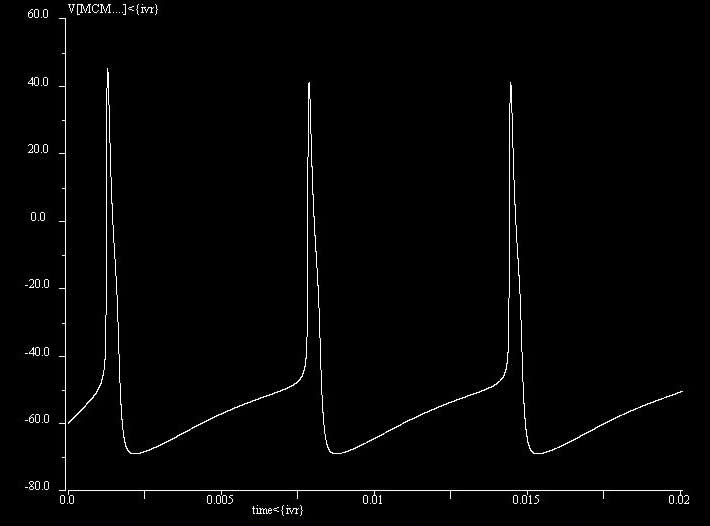
The minimal cell model (MCM) is a reduced Hodgkin-Huxley model that can exhibit excitable and oscillatory behavior. It consisting of two ordinary differential equations, dV/dt for membrane voltage and dW/dt for potassium activation and sodium inactivation). The MCM has a stable membrane potential of -60mV. With constant input current of 10uA/cm2, it exhibits oscillations of 150Hz.It is based on the work by FitzHugh and Rinzel.
R15

The goal of the present simulation is to illustrate how SNNAP can be used to simulation the biophysical properties of a relatively complex neuron.
The components of the R15 neuron are illustrated in R15_neu.jpg and Butera_model.jpg. The model contains eight ionic conductances, an intracellular pool of calcium (i.e., Ca.ion), an intracellular pool of second messenger (i.e., cAMP.sm), and modulatory interactions from the ion and second messenger pools and the membrane conductances.
The results of the default simulation are illustrated in R15ous.gif. The model produces endogenous bursting activity. At time=60sec a modulator is applies via the treatment file (i.e., R15.trt). The resultant increase in the second messenger and modulation of membrane conductances alters the electrical activity of the neuron.