Modulation
This subdirectory contains simulations that illustrate the capacity of SNNAP to simulate intracellular pools of messengers, which in turn can modulate each other, synaptic transmission and membrane conductances.
fBR test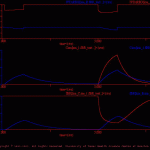
This simulation illustrates and tests the fBR function, which is used to define the modulation of membrane conductances, pools of transmitter and second messenger by intracellular pools of ions and/or second messengers.
As illustrated in fBR_test_model.jpg, the model cell (fBR_test.neu) contains three membrane conductances: ion_A, ion_B and ion_C (ion_A.vdg, ion_B.vdg and ion_C.vdg, respectively). These are simple ohmic conductances (i.e., the conductances are not voltage-dependent). The current flow through ion_A contributes to an intracellular ion pool (ion_1.ion), which in turn modulates the conductance of ion_B. This modulatory relationship is defined in the file ion1_2_ionB.fBR. In this example, increases in the concentration of ion_1 enhance the conductance of ion_B. In addition, there is an intracellular pool of second messenger (sm_1.sm). The synthesis of sm_1 is driven by an external signal (mod_1), which is defined in the treatment file (fBR_test.trt). In this example, increases in the concentration of sm_1 diminish the conductance of ion_C (sm1_2_ionC.fBR).
The results of the default simulation are illustrated in fBRtst_ous.gif.
Ion 2 sm test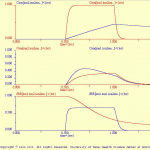
This simulation illustrates and tests the ability of an intracellular ion pool to modulate a second messenger.
As illustrated in ino_2_sm_test_model.jpg, the model cell (ion_2_sm_test.neu) contains 1 ion membrane conductance (leak.vdg). This is a simple ohmic conductance (i.e., the conductance is not voltage-dependent). The current flow through the leak conductance contributes to two intracellular ion pools (ion1.ion and ion2.ion). The cell also contains two-second messengers (sm1.sm and sm2.sm). The synthesis of sm1 and sm2 is governed by an extrinsic modulator (Mod_1 in the treatment file) and by the intracellular ion pools. ion1 enhances the synthesis of sm2 (ion1_2_sm2.fBR). The synthesis of sm1 is dually regulated by ion1 and ion2. ion1 enhances the synthesis of sm1, whereas ion2 diminishes its synthesis.
The results of the default simulation are illustrated in ion2smTst_ous.gif.
Ion test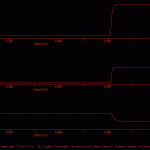
This simulation illustrates and tests the ion function, which is used to define the dynamics of intracellular pools of ions.
As illustrated in ion_test_model.jpg, the model cell (ion_test.neu) contains ion membrane conductances: ion, (ion.vdg). This simple ohmic conductance (i.e., the conductance is not voltage-dependent). The current flow through ion contributes to an intracellular ion pool (ion.ion). The dynamics of this ion pool are defined in the file ion_test.ion.
The results of the default simulation are illustrated in ionTst_ous.gif. A shift in the membrane potential elicited an inward current, which in turn produced an increase in the intracellular concentration the ion.
Metabotropic Osc
The goal of the present simulation is to illustrate how SNNAP can be used to simulate relatively complex modulatory interactions within a neuron.
This subdirectory contains a single simulation: C2_excit.smu, which in turn is a single-cell model. The components of the neuron (i.e., C2.neu) are illustrated in C2_neu.jpg and Metabotropic_ Oscillator.jpg. This cell is a conditional oscillator with a rather unique method for generating bursting activity.
Osc Ion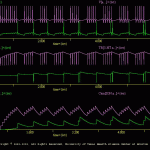
The goal of the present simulation was to illustrate how to implement an intracellular ion pool and use this pool to modulate synaptic strength.
This simulation is an extension of the three cell network found in \examples\neural_networks\osc.smu. That simple three-cell network functions as a central pattern generator (CPG) and when an extrinsic depolarizing current was injected into cell ‘a’, the network produced a pattern of alternating bursts in cells ‘a’, ‘b’ and ‘c’ (see Oscillation.jpg).
In the current simulation, two interacting forms of homosynaptic plasticity were incorporated: synaptic depression and facilitation. Homosynaptic depression was implemented by setting Xt=Tr and using equation 3 in the *.tr file. The parameters were set to rapidly depress synaptic release and the recovery from this depression also was rapid. This depression reduced synaptic efficacy to the extent that the network was no longer able to function as a central pattern generator (CPG) (compare Oscillation.gif and osc_sans_ion_ous.jpg).
Homosynaptic facilitation was implemented by incorporating an ion pool, which in turn up-regulated synaptic strength (compare osc_sans_ion_neu.jpg and osc_ion_neu.jpg). With the ion pool in place, activity in cell ‘a’ leads to increasing synaptic strength (i.e., Tr), which in turn allows cell ‘a’ to fire cell ‘b’ and once again produce patterned activity (compare Oscillation.jpg and oscIonOus.gif).
Osc Mod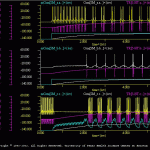
The goals of the present simulation are to illustrate how to implement a modulatory synapse, an intracellular second messenger pool, and have that pool modulate synaptic strength. In addition, this simulation illustrates the ‘minj’ (i.e., modulator injection) treatment.
This simulation is an extension of the \examples\Neural_networks\osc.smu simulation. The osc.smu simulation was extended to include intracellular pools of transmitters (*.tr) and second messengers (*.sm), a modulatory synapses (*.ms) and homo- and heterosynaptic plasticity. Thus, osc_mod.smu illustrates many of the features of SNNAP.
The structure of the new osc.ntw is illustrated in osc_mod_ntw.jpg and the structure of the new neurons is illustrated in osc_mod_neu.jpg.
Homosynaptic Depression: Each of the chemical synapses (*.cs) incorporates homosynaptic depression. This was implemented by having Xt=Tr and using equation 3 in the *.tr file. Although this synaptic depression recovers rapidly, it reduces synaptic efficacy to the point that network (*.ntw) will no longer generate patterned activity (compare osc_sans_mod_ous.jpg to Oscillation.jpg).
The simulation osc_sans_mod.smu (i.e., without modulation), cell ‘c’ is spontaneously active and a depolarization current is injected into cell ‘a’, which elicits activity in cell ‘a’. This aspect of the simulation is similar to \examples\neural_networks\osc.smu. Note, however, that cell ‘b’ does not fire and no patterned activity is generated.
Heterosynaptic Facilitation: Each cell includes a pool of transmitters, which in turn, is up-regulated by a second messenger. Thus, when the modulatory synapse from cell ‘a’ to ‘c’ is active or when extrinsic modulators are applied via the treatment file (*.trt), synaptic efficacy is increased.
As the synaptic increases, the network once again can function as a central pattern generator (CPG). The results of this simulation are illustrated in oscMod.gif. Note that all three cells receive an extrinsic modulatory input from the *.trt. This is equivalent to an experimental bath applying a modulator to the neural network. The user can selectively apply the modulator to individual cells and determine the relative contribution of each component to the CPG function of the network.
Sens Excitatory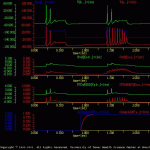
The goals of the present simulation are to illustrate how to implement and intracellular second messenger pool and how this pool can modulate a membrane conductance.
This simulation illustrates how the modulation of a membrane current can alter the excitability of a neuron. Two identical neurons are illustrated: cells ‘a’ and ‘b’. The components of these cells is illustrated in Sens_Neuron.jpg
Each cell is stimulated with two identical current pulses (sIex). During the first pulse identical responses were elicited from the two cells.
Before the second current pulse, the second messenger system in cell ‘a’ is activated with a treatment. The second messenger, in turn, modulates one of the membrane conductances in cell ‘a’. Thus, during the second current pulse, more spikes were elicited in cell ‘a’ than cell ‘b’.
The results of this simulation are illustrated in sensExcit.gif.
Note: that the overall scale of each trace is identical. The baselines of the traces have been shifted, however, so that overlapping responses were observed clearly. The user could have displayed each trace on a separate ‘channel’, but this would have made the display very large.
Note: that the stimulus current (sIex; blue trace) can be displayed.
