Synaptic Connections
This subdirectory contains simulations that illustrate how to implement synaptic connections and synaptic plasticity in SNNAP.
SNNAP can simulate a wide array of synaptic connections, including chemical (excitatory, inhibitory, fast, slow, increase conductance, decrease conductance), modulatory (i.e., stimulating the synthesis of second messengers) and electrical (symmetric and asymmetric). In addition, SNNAP can simulate homo- and heterosynaptic plasticity (depression and facilitation) and can simulate synaptic connections that are both time- and voltage-dependent (e.g., NMDA responses).
The basic process of creating a chemical synapse is illustrated in the \chemical subdirectory (see also alpha1 and alpha2). Examples of voltage-dependent synaptic connections are illustrated in the \favt_test subdirectory. Examples of homosynaptic plasticity are in the \PSM_TR_functions subdirectory and an example of a modulatory synapses is in the \hetero subdirectory.
alpha1
The goal of the present simulation is to illustrate how to implement a synaptic connection using an alpha function (i.e., equation 1, keyword At:, *.fAT).
This simulation illustrates how to use an alpha function (i.e., equation 1, keyword At:, *.fAt) to describe the kinetics of a synaptic conductance. To alter the kinetic of the synaptic response, the user alter the time constant (i.e., u in equation 1).
Note: that in an alpha function, altering the time constant also alters the amplitude of the response (see the Excel worksheet alpha_function.xls). To avoid this, the user must select equation 2, keyword fAt:, *.fAt. Equation 2 ‘normalizes’ the synaptic amplitude and keeps it constant despite changes in the time constant. The results of this simulation are illustrated in alpha1.gif.
alpha2
The goal of the present simulation is to illustrate how to implement a synaptic connections using a version of the alpha function with two time constants (i.e., equation 2, keyword At:, *.fAt).
This simulation illustrates equation 2, keyword At:, *.fAt, which also an alpha function. This version of the alpha function has two time constants (u1, u2, in equation 2), which allow the user to independently control the rising and falling phases of the synaptic response. The user is cautioned to use equation 2, keyword fAt: (see alpha1 example). The results of this simulation are illustrated in alpha2.gif.
Chemical
The goal the present simulations is to illustrate how to construct various types of synaptic connections. This subdirectory contains three simulations:
Decrease Conductance (CS decr.smu)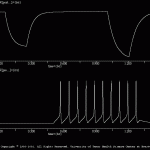
Not all synaptic responses are mediated via increases in the conductance of the postsynaptic cell. Some responses are mediated via decreases in the postsynaptic conductance. This simulation illustrate one method of implementing a decrease conductance synaptic response. The parameters were adjust such that little or no change in the postsynaptic membrane potential was produced. The change in postsynaptic conductance was monitored by inject identical current pulses into the postsynaptic cell. The response to the second current injection (i.e., the injection during the decrease conductance synaptic response) was larger, which indicates an increase in the input resistance of the postsynaptic cell (i.e., a decrease in conductance). The results of this simulation are illustrated in CS_decr.gif.
The alter the kinetics of a synaptic potential, change the ‘u’ parameter in the *.fAt file.
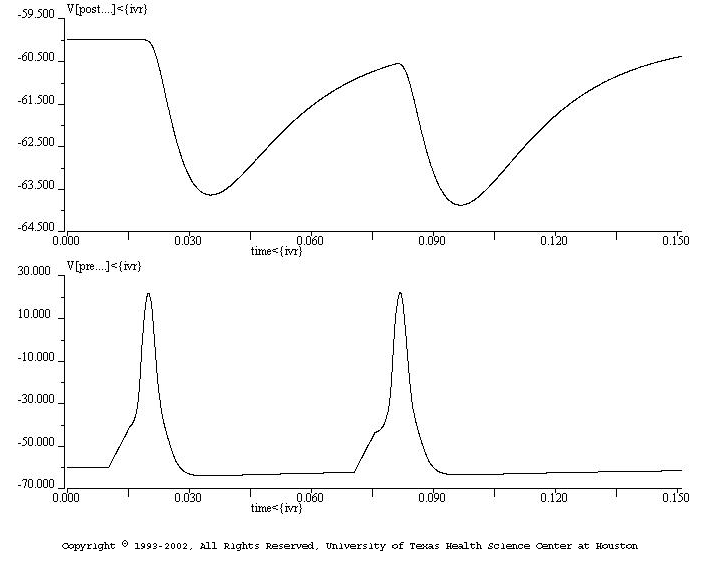
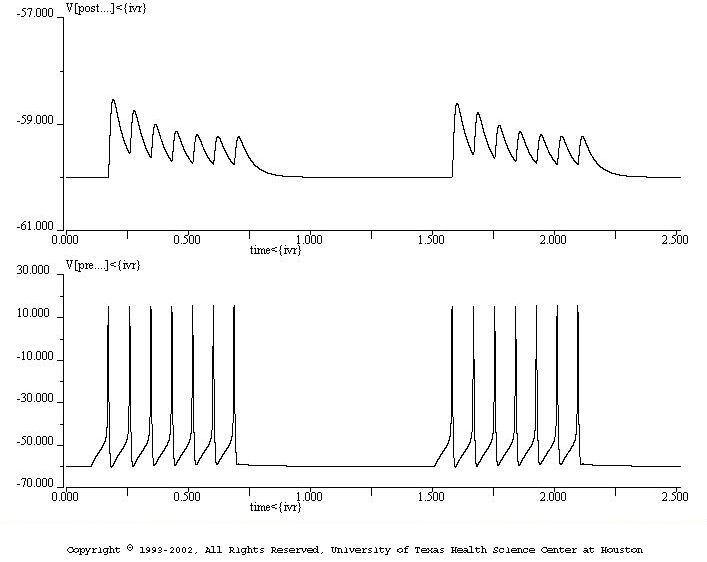
Excitatory (CS exec.smu)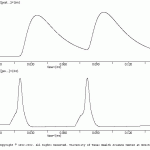
This simulation illustrates how to make a simple excitatory synaptic connections between two cells (pre and post). The results of this simulation are illustrated in CS_exc.gif. Note the two EPSPs are identical (i.e., no synaptic plasticity was included). By varying the timing of the second presynaptic action potential the user can illustrate temporal summation of EPSPs.
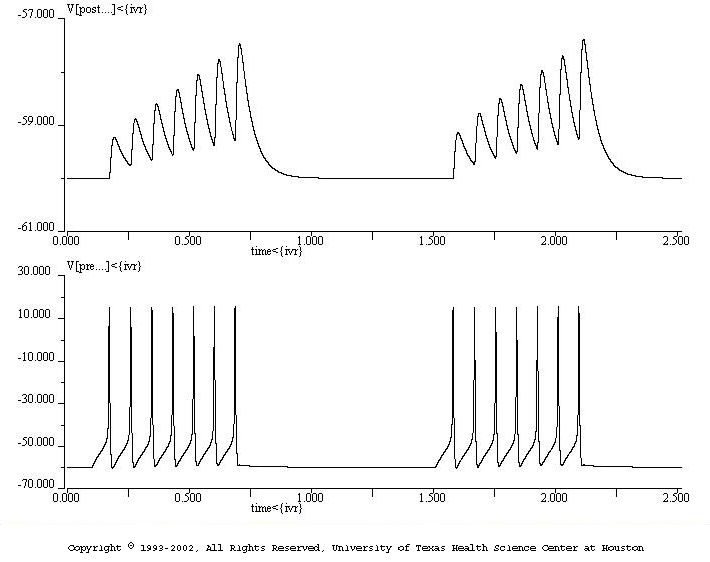
Inhibitory (CS inh.smu)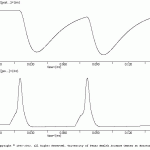
This simulation illustrates how to make a simple inhibitor synaptic connections between two cells (pre and post). The primary difference between excitatory and inhibitory synaptic potentials is their reversal potential relative to the rest potential of the postsynaptic cell. The results of this simulation are illustrated in CS_exc.gif. Note the two IPSPs are identical (i.e., no synaptic plasticity was included). By varying the timing of the second presynaptic action potential the user can illustrate temporal summation of IPSPs. Perhaps more importantly, the user can inject depolarizing current pulses into the postsynaptic cell and demonstrate how IPSP can shunt postsynaptic potentials and thereby inhibit the postsynaptic cell.
Electrical Synapse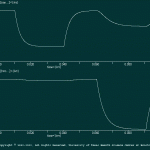
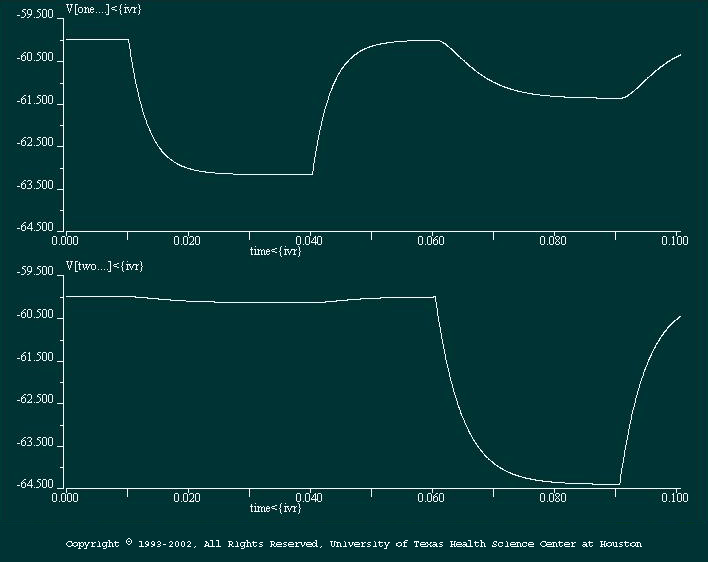
Electrical Synapse This simulation illustrates how to implement an electrical synaptic connection between two cells (cells ONE and TWO). The properties of the two cells are identical. Identical current hyperpolarizing current pulses are injected into each cell. The first pulse was injected into cell ONE, and the second pulse was injected into cell TWO. SNNAP allows the user to establish asymmetrical coupling between cells and this example illustrates this feature.
modulatory syn
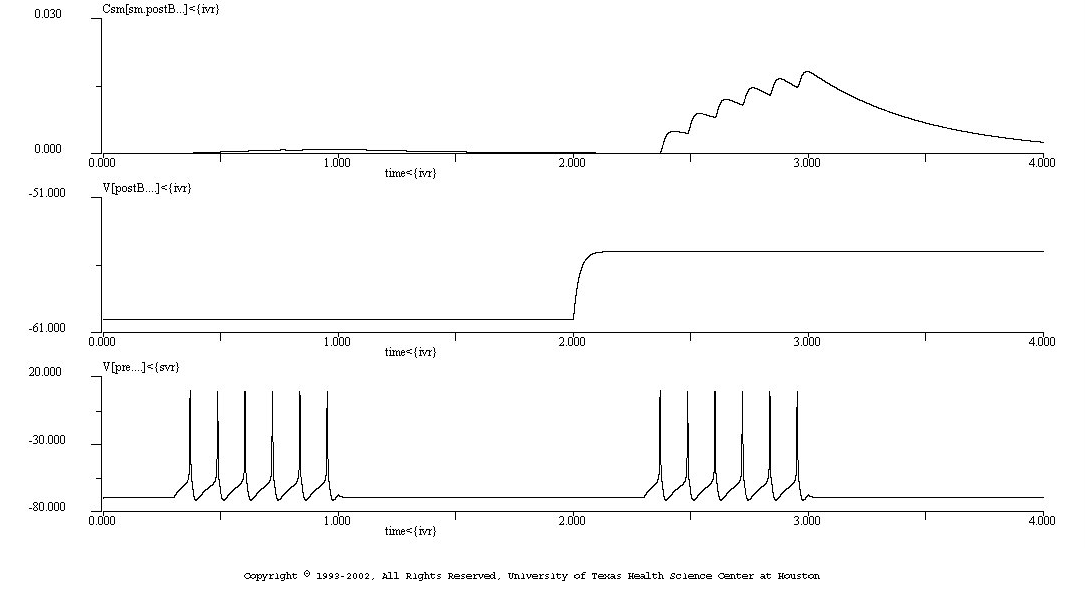
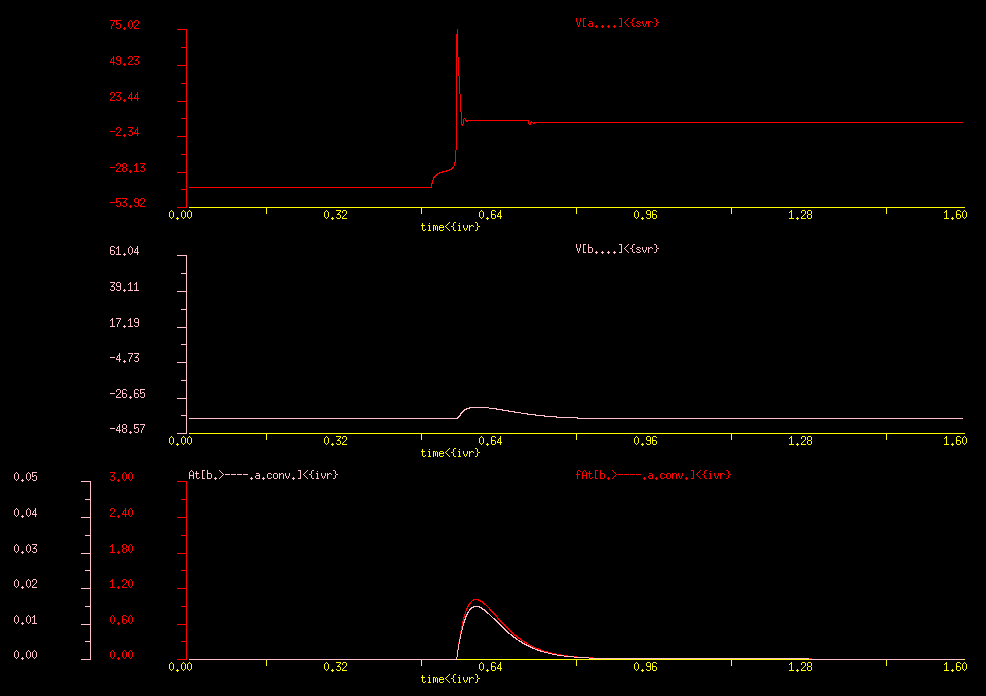
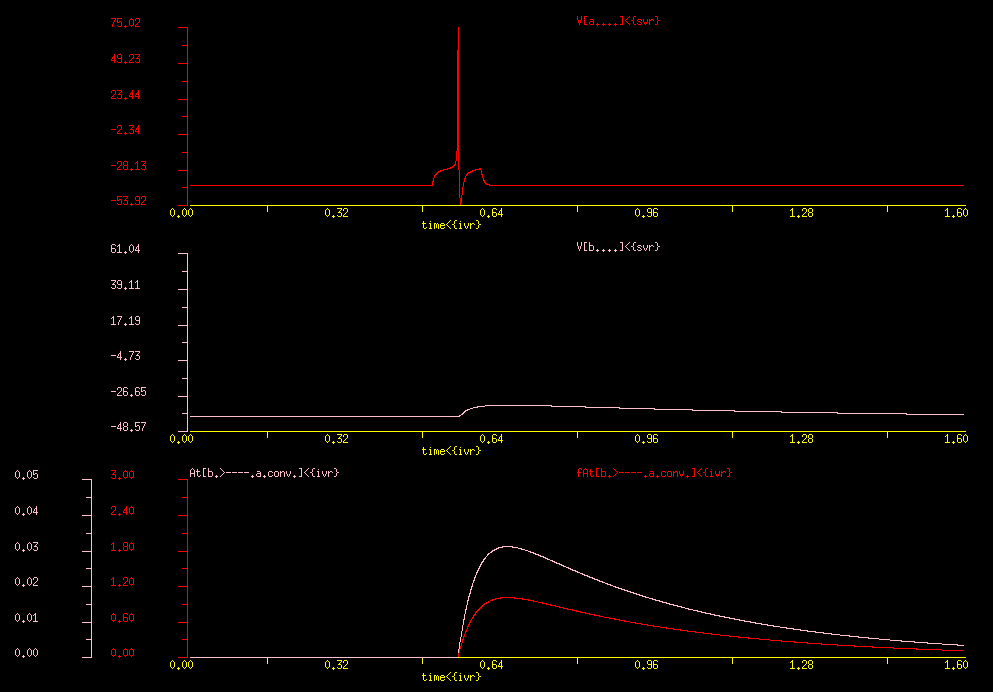
This simulation tests / demonstrates a voltage- and time dependent modulatory synapse.
The network has two cells: pre and postB. The presynaptic cell (pre) makes a voltage- and time -dependent modulatory synapse onto a postsynaptic cell (postB).
Two stimuli are applied to “pre”. During the first stimulus, “postB” is at rest and little second messenger is formed. During the second stimulus, “postB” is depolarized by an extrinsic current. The depolarization of “postB” allows for second messenger to be formed.
This function might be used to simulate aspects of a NMDA-type response.
Your simulation should look like the image in: favt_tst_modsyn.gif
hetero facil
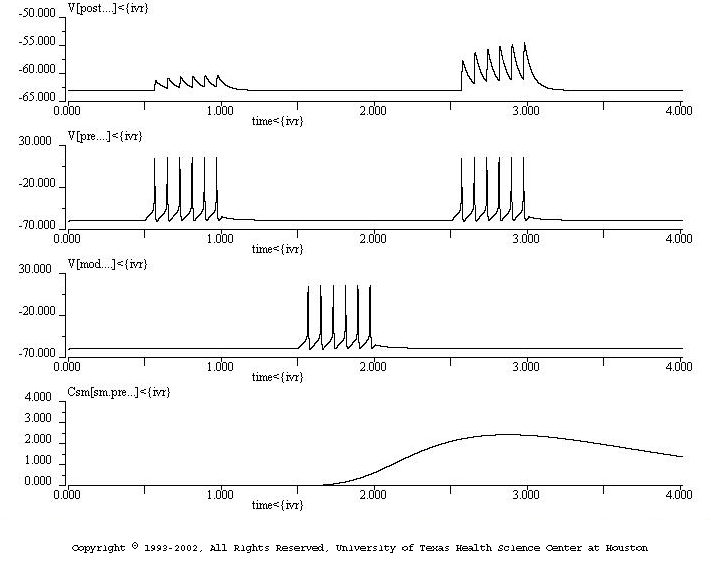
The goal of the present simulation is to illustrate how to implement heterosynaptic plasticity.
This simulations illustrates several features of SNNAP, including: use of the *.tr (i.e., transmitter pool), use of the *.ms (i.e., modulatory synapse), use of the *.fBR function (i.e., function describing the regulation of a neuronal property such a the transmitter pool by a ‘regulator’), and use of *.sm (i.e., second messenger).
The simulation contains three neurons (pre, post, and mod). The network is illustrated in hetero_ntw.jpg. The pre.neu makes an excitatory synaptic connections with the post.neu. The mod.neu makes a modulatory synaptic connection with the pre.neu.
Two stimuli are applied to the pre.neu. These stimuli elicit spiking in pre.neu, which in turn, produces EPSPs in the post.neu. Between these two stimuli a stimulus is applied to the mod.neu. This stimulus elicit spiking in mod.neu, but this activity in mod.neu does not produce and overt response in pre.neu. The activity in mod.neu does, however, elicit an increase in the concentration of the second messenger in pre.neu (i.e., Csm[sm.pre…]). The second messenger, in turn, up regulates the size of the transmitter pool (not shown).
As of result of this modulation the second burst of activity in pre.neu elicits larger EPSPs in post.neu (i.e., heterosynaptic facilitation).
The results of this simulation are illustrated in hetero_facil.gif.
PSM TR functions
The goal of the present simulations is to illustrate how to implement various forms of homosynaptic plasticity by using the Xt, Tr and PSM functions. Other methods for implementing synaptic plasticity are illustrated in \hetero, \osc_mod, and \osc_ion.
This set of simulations demonstrates / tests the PSM (i.e. plasticity-simple-method) and TR (i.e., transmitter) functions. The PSM function is used to implement homosynaptic plasticity. The TR function can be used to implement either homo- or heterosynaptic plasticity. (For an example of heterosynaptic plasticity, see \examples\synapses\hetero).
There are 4 simulations in this subdirectory:
PSM depression
This simulation illustrates how to implement simple homosynaptic depression. The rate at which depression accumulates is governed by the time constant ‘ud’ in the PSM_dep.Xt file. The current value is 5 msec. If the user increases this time constant, then the amount of depression will decrease. The recovery from depression is governed by the time constant ‘ur’ in the PSM_dep.Xt file. The current value is 300 msec. If the user increases this time constant, then there will be less recovery and thus more depression. The results of this simulation are illustrated in PSM_deprsn.gif.
PSM facilitation
This simulation illustrates how the PSM function can be used to implement facilitation. The method is simple to depression (see above). The only different is that the ‘ud’ time constant has a negative value. The current value is -10 msec. By adding the negative sign, the function dPSM/dt is positive (i.e., increasing) function during presynaptic spiking. Thus, synaptic strength is increased. The results of this simulation are illustrated in PSM_fcln.gif.
TR facilitation
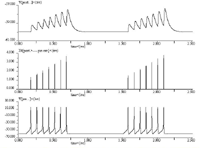
The *.tr file contain a dTR/dt function that is similar to the dPSM/dt function. Thus, the *.tr file can be used to implement homosynaptic plasticity, just as the *.Xt file and PSM function can be used to implement facilitation and depression. The results of this simulation are illustrated in TR_fcln.gif. Changes in the values of Xt during the simulation also illustrated. The Xt variable determines, in part, the amplitude of the synaptic potential (see equation 3 under keyword At: in *.fAt file).
NOTE: If the user wishes to the use the dTR/dt function, he/she must also select one of the ssTR functions. Moreover, the user must modify the appropriate *.neu file, such that it calls the appropriate *.tr file.
TR PSM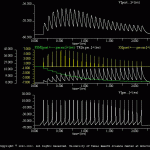
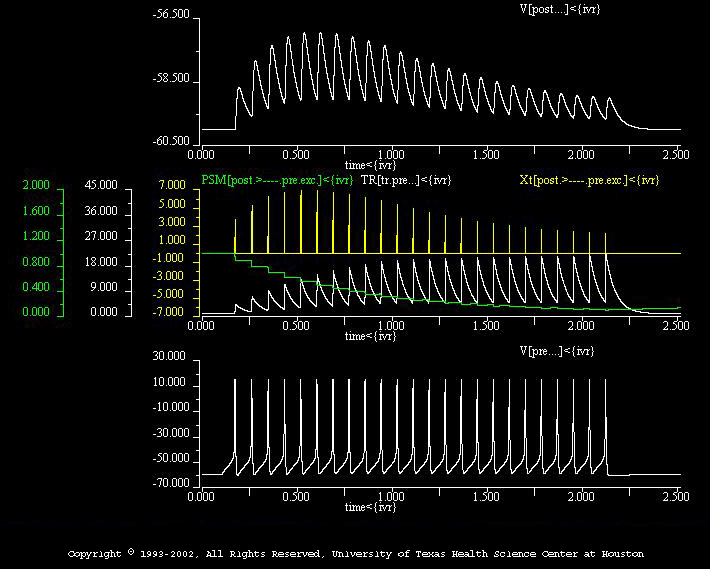
SNNAP can also simulate the interactions among multiple forms of homo-and hetero-synaptic plasticities. This simulation demonstrates one example. In TR_PSM.smu, homosynaptic depression is implemented via the PSM function in the *.Xt file. Homosynaptic facilitation is implemented via the TR function in the *.tr file. The interaction of the two is implemented via equation 4 of the *.Xt file (i.e., Xt=TRxPSM, where TR is an increasing function and PSM is a decreasing function). The results of this simulation are illustrated in TR_PSM.gif, which also illustrate the Xt, TR and PSM functions.