Screen Display
This subdirectory contains simulations that illustrate how to display data on the screen. The data can be displayed as the simulation is running or can be store to a file and displayed later.
Phase Plane
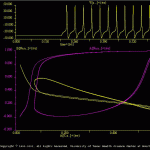
This simulation illustrates the ability of SNNAP to plot variables in phase planes.
The upper display is a time series of the voltage in cell A. The lower display is a phase plane project of Na activation (i.e., A[Na.a…]) vs. K activation (i.e., A[K.a…]) and Na inactivation (i.e., B[Na.b…]) vs. K activation. This type of analysis lead to the development of the FitzHugh-Nagumo model. The results of this simulation are illustrated in phasePln.gif.