Conventional αSyn-SAA
Materials:
- PIPES-NaOH pH 6.5 (0.5M stock)
- NaCl (4M stock)
- Purified α-Syn protein
- Thioflavin-T (ThT; 5mM stock)
- Multichannel
- Reservoir
- 96-well black, flat-bottom plate with lid
- Optical film (squared edges)
- Plate sealer
Procedure:
- A 200µL of αSyn-SAA reaction mix is prepared for each CSF sample by combining 40 µL CSF and 160 µL master mix. The final reaction mix contains 1 mg/ml rec-αSyn in 1XPBS, 100 mM PIPES pH 6.50, 500 mM NaCl, and 5 µM ThT. The concentration of rec-αSyn determines the volume of NaCl needed to reach 500 mM, as the 1XPBS buffer contains 154 mM NaCl.
- Place a COSTAR 96-well plate on ice and add 200µL of water to the outer wells to minimize the potential evaporation of the reaction mix. Thus, only the 60 inner wells are used to test samples. Cover the plate with the lid while preparing the reaction mix.
- Prepare the master mix (- αSyn) by adding PIPES, NaCl, water and ThT except rec-αSyn monomers. Swirl the tube to mix the contents and keep it on ice. Prechill a reservoir compatible with multichannel pipetting.
- Thaw the CSF samples in cold tap water to accelerate the thawing process. Samples can also be thawed on the bench without water.
- Vortex the CSF samples to mix the contents and briefly centrifuge the samples to spin down the CSF attached to the bottom of the tube lid.
- Remove the lid of the plate and add 40 µL of each CSF sample to 3 wells in the plate to analyze samples in triplicate. Change the low retention tip for each of the wells/replicates.
- Once all the CSF samples are loaded in the plate, thaw the rec-αSyn protein in tap water.
- Now finish making the master mix by adding rec-αSyn. Swirl the tube to mix the contents.
- Distribute the substrate mix in the prechilled reservoir and add 160 µL to each of the wells with CSF samples in them using a multichannel pipette. Mix the reaction mixture by pipetting up and down a few times in each well.
- Remove the plate from the ice and seal it with a MicroAmp film using a rubber roller.
- Remove the side tabs of the film and measure time zero fluorescence using the Gemini Spectra EM with the above-mentioned settings. Export the readings as an Excel™ file for subsequent analysis.
- Place the plate on the Thermomixer R inside the incubator and cover the plate with aluminum foil to protect the reaction mixture from direct light.
- Start the reaction by starting the shaking/incubation cycle in the Thermomixer R.
- Read the plate every 12h for 360-400h (15-17 days). Preheat the fluorometer to 37°C before every reading. Pause the Thermomixer R right before the shaking part of the cycle, remove the plate from the Thermomixer R and place it between 2 plates filled up with water and sealed stored at 37°C to maintain the temperature of the plate during reading.
- Read fluorescence at 485nm, place the plate back in between the 2 plates at 37°C, and place it back onto the Thermomixer R. Resume the shaking/incubation cycle. Export each reading as an Excel™ file for subsequent analysis.
- Determine the maximum fluorescence (Fmax) for each replicate. This can be easily determined by using the function = MAX() in Excel.
- Compare Fmax to a positivity fluorescence threshold that must be determined based on the fluorometer used. In the case of the Gemini EM setup to Auto PMT sensitivity, we have used thresholds of 50 AU, 1,000AU, 150AU, depending on whether all forms of synucleinopathies are being studied or only PD. Thus, if Fmax > threshold, the replicate is considered positive. The information of all 3 replicates is integrated as follows:
| Experimental Result | αS-SAA Result |
| 3 positive replicates | αSyn-SAA Positive sample (PD or MSA) |
| 2 positive replicates | αSyn-SAA Inconclusive |
| 0 or 1 positive replicate | αSyn-SAA Negative sample (HC or below detection) |
- Further analyze results for αSyn-SAA Positive samples to determine if they correspond to PD or MSA. This determination is performed using the average measured Fmax of the 3 replicates. The average of the estimated Fmax calculated by fitting a model to the aggregation curve can be used as well (see kinetic analysis).
| Experimental Result | αS-SAA Result |
| 50 AU < Average Fmax < 1,800 AU | MSA |
| Average Fmax > 2,000 AU | PD |
Kinetic analysis requires all the data points collected during the experiment. Prepare a time vs fluorescence table for each sample. Using GraphPad Prism, fit the following Boltzmann exponential model to the data:
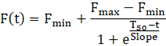
As fluorescence readings are performed manually, estimated Fmax is more representative than the measured Fmax. Estimated Fmax, Fmin, T50, and slope, can be used for correlation studies. T50 has been shown to depend on the mass of synthetic αSyn seeds and was shown to correlate with the Hoehn and Yahr Scale Score in a small cohort study.
*********************************