Stability Assay for Brain Derived Aggregates
Purification
- Homogenize 0.5 g frozen brain tissue to 10% (w/v) in PBS with 1x protease inhibitor cocktail (Roche) and 1x Halt phosphatase inhibitor cocktail.
- Incubate homogenate on ice for 30 minutes with 0.5% sodium deoxycholate, 0.5% NP-40, 0.75 U/uL Benzonase, 2 mM MgCl2 and 1x Halt phosphatase inhibitor cocktail and 1x protease inhibitor cocktail (Roche).
- Centrifuge sample at 1,000g for 5 minutes at 4o
- Remove supernatant and centrifuge at 100,000g for 1 hour at 4o
- Resuspend pellet in 400 uL (PBS+PI) per gram tissue.
Stability Procedure
- In 230 uL ultracentrifuge tubes, incubate sample with 0, 1, 2, 3, 4, 5, and 6 M GdnHCl at room temperature for 2 hours. Cover with parafilm and vortex gently every 30 minutes.
i. 0-4 M: 40 uL (PBS+PI or 2-8 M GndHCl)
20 uL (PBS+PI)
20 uL (sample)
ii. 5 M: 50 uL (8 M GdnHCl)
10 uL (PBS+PI)
20 uL (sample)
iii. 6 M: 60 uL (8M GdnHCl)
20 uL (sample)
Note: Increase or decrease sample volume depending on yield from purification procedure.
- Centrifuge samples using a Beckman 42.2 Ti rotor at 100,000 g (28,700 rpm) and 23oC for 1 hour.
- Mark pellet position on each tube prior to removing them from rotor.
- Remove supernatant.
- Add 100 uL PBS+ PI to each tube and centrifuge again at 100,000 g and 23oC for 1 hour.
- Remove supernatant.
- Dissolve pellets in 10 uL PBS+PI.
- Add 10 uL NuPage 2x sample buffer and cap tubes. Boil at 95oC for 10 minutes.
- Run SDS-PAGE gel using 12% Bis-tris gels and MES (1x) running buffer at 155 V for 75 minutes.
- Transfer protein to nitrocellulose membrane for 1 hour at 100 V.
- Block membrane with 5% milk for 1 hour.
- Blot membrane with anti-a-synuclein (BD clone 42; 1:1000) overnight at 4o
- Wash membrane three times, 10 minutes each, with PBS-T (0.1%).
- Blot with anti-mouse conjugated secondary (Sigma; 1:2000) for 1 hour at room temperature.
- Develop with ECL and image.
Western Blot Analysis & Denaturation Curve Procedure
- Open 1SC Files in Image Lab.
- Export image to a JPG file (select the image with the longest exposure that is not oversaturated).
a. File -> Export -> Export for Publication -> Change ‘Publishing Resolution (dpi)’ to ‘600 dpi’ -> Export
- Open exported JPG file in ImageJ.
- Subtract background from image.
a. Process -> Subtract Background -> Set ‘Rolling ball radius:’ to 50.0 pixels* -> Select ‘Light background’ -> OK (*Set rolling ball radius higher for less subtraction)
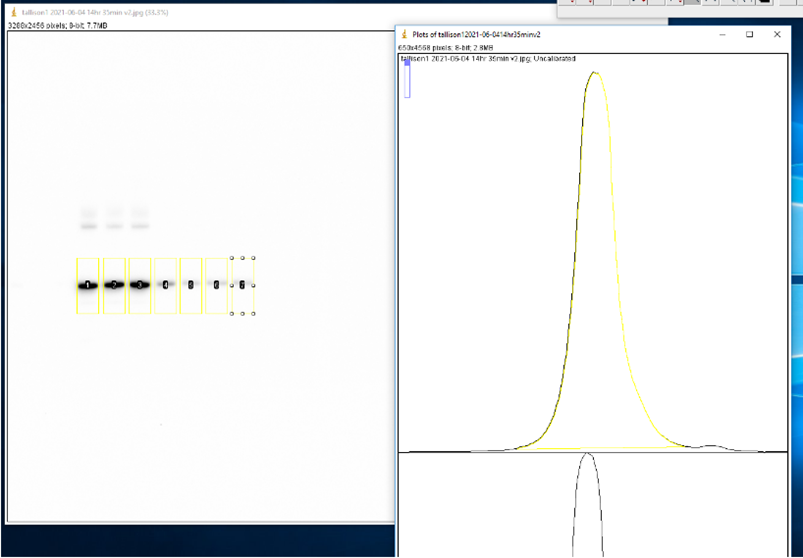
- Use the Rectangle tool to select the first lane (0 M GdnHCl). Press ‘1’ on keyboard to label as the first lane. Reposition selection box to each consecutive lane and press ‘2’ to label each one. Press ‘3’ to label the last lane. ImageJ will automatically graph the density of the bands in each well.
- Use the Line tool to enclose the bottom of each curve.
- Use the Wand tool to select the area under each curve. A window will open with the area.
- Copy the area values to an XY table in GraphPad Prism version 9.1.1 with a single Y value for each point.
- Normalize the density values.
a. Analyze -> Data Processing -> Normalize -> Define 0% as Y=0, and 100% as “Last value in each data set (or first, whichever is larger) -> OK
- A new results table will be created with the normalized values.
- Create a Nonlinear Regression Curve to determine the GdnHCl50 (the guanidine concentration at with half of the aggregates have been denatured).
a. Analyze -> Regression and Curves -> Nonlinear Regression (Curve Fit) -> OK -> Select ‘Sigmoidal dose-response (variable slope)’ -> New -> Clone the selected equation -> Select ‘Default Constraints’ tab -> Change the bottom parameter to ‘Constant equal to 0’ and the top parameter to ‘Constant equal to 100’ -> OK -> Select the new equation created -> OK
b. A new results tab will be created with the non-linear fit analysis. The ‘LogEC50’ values will be the GdnHCl50.